
Sportico Editorial Website & Franchise Valuation Platform
Article
Client
Sportico + Penske Media
1. Objective & Scope
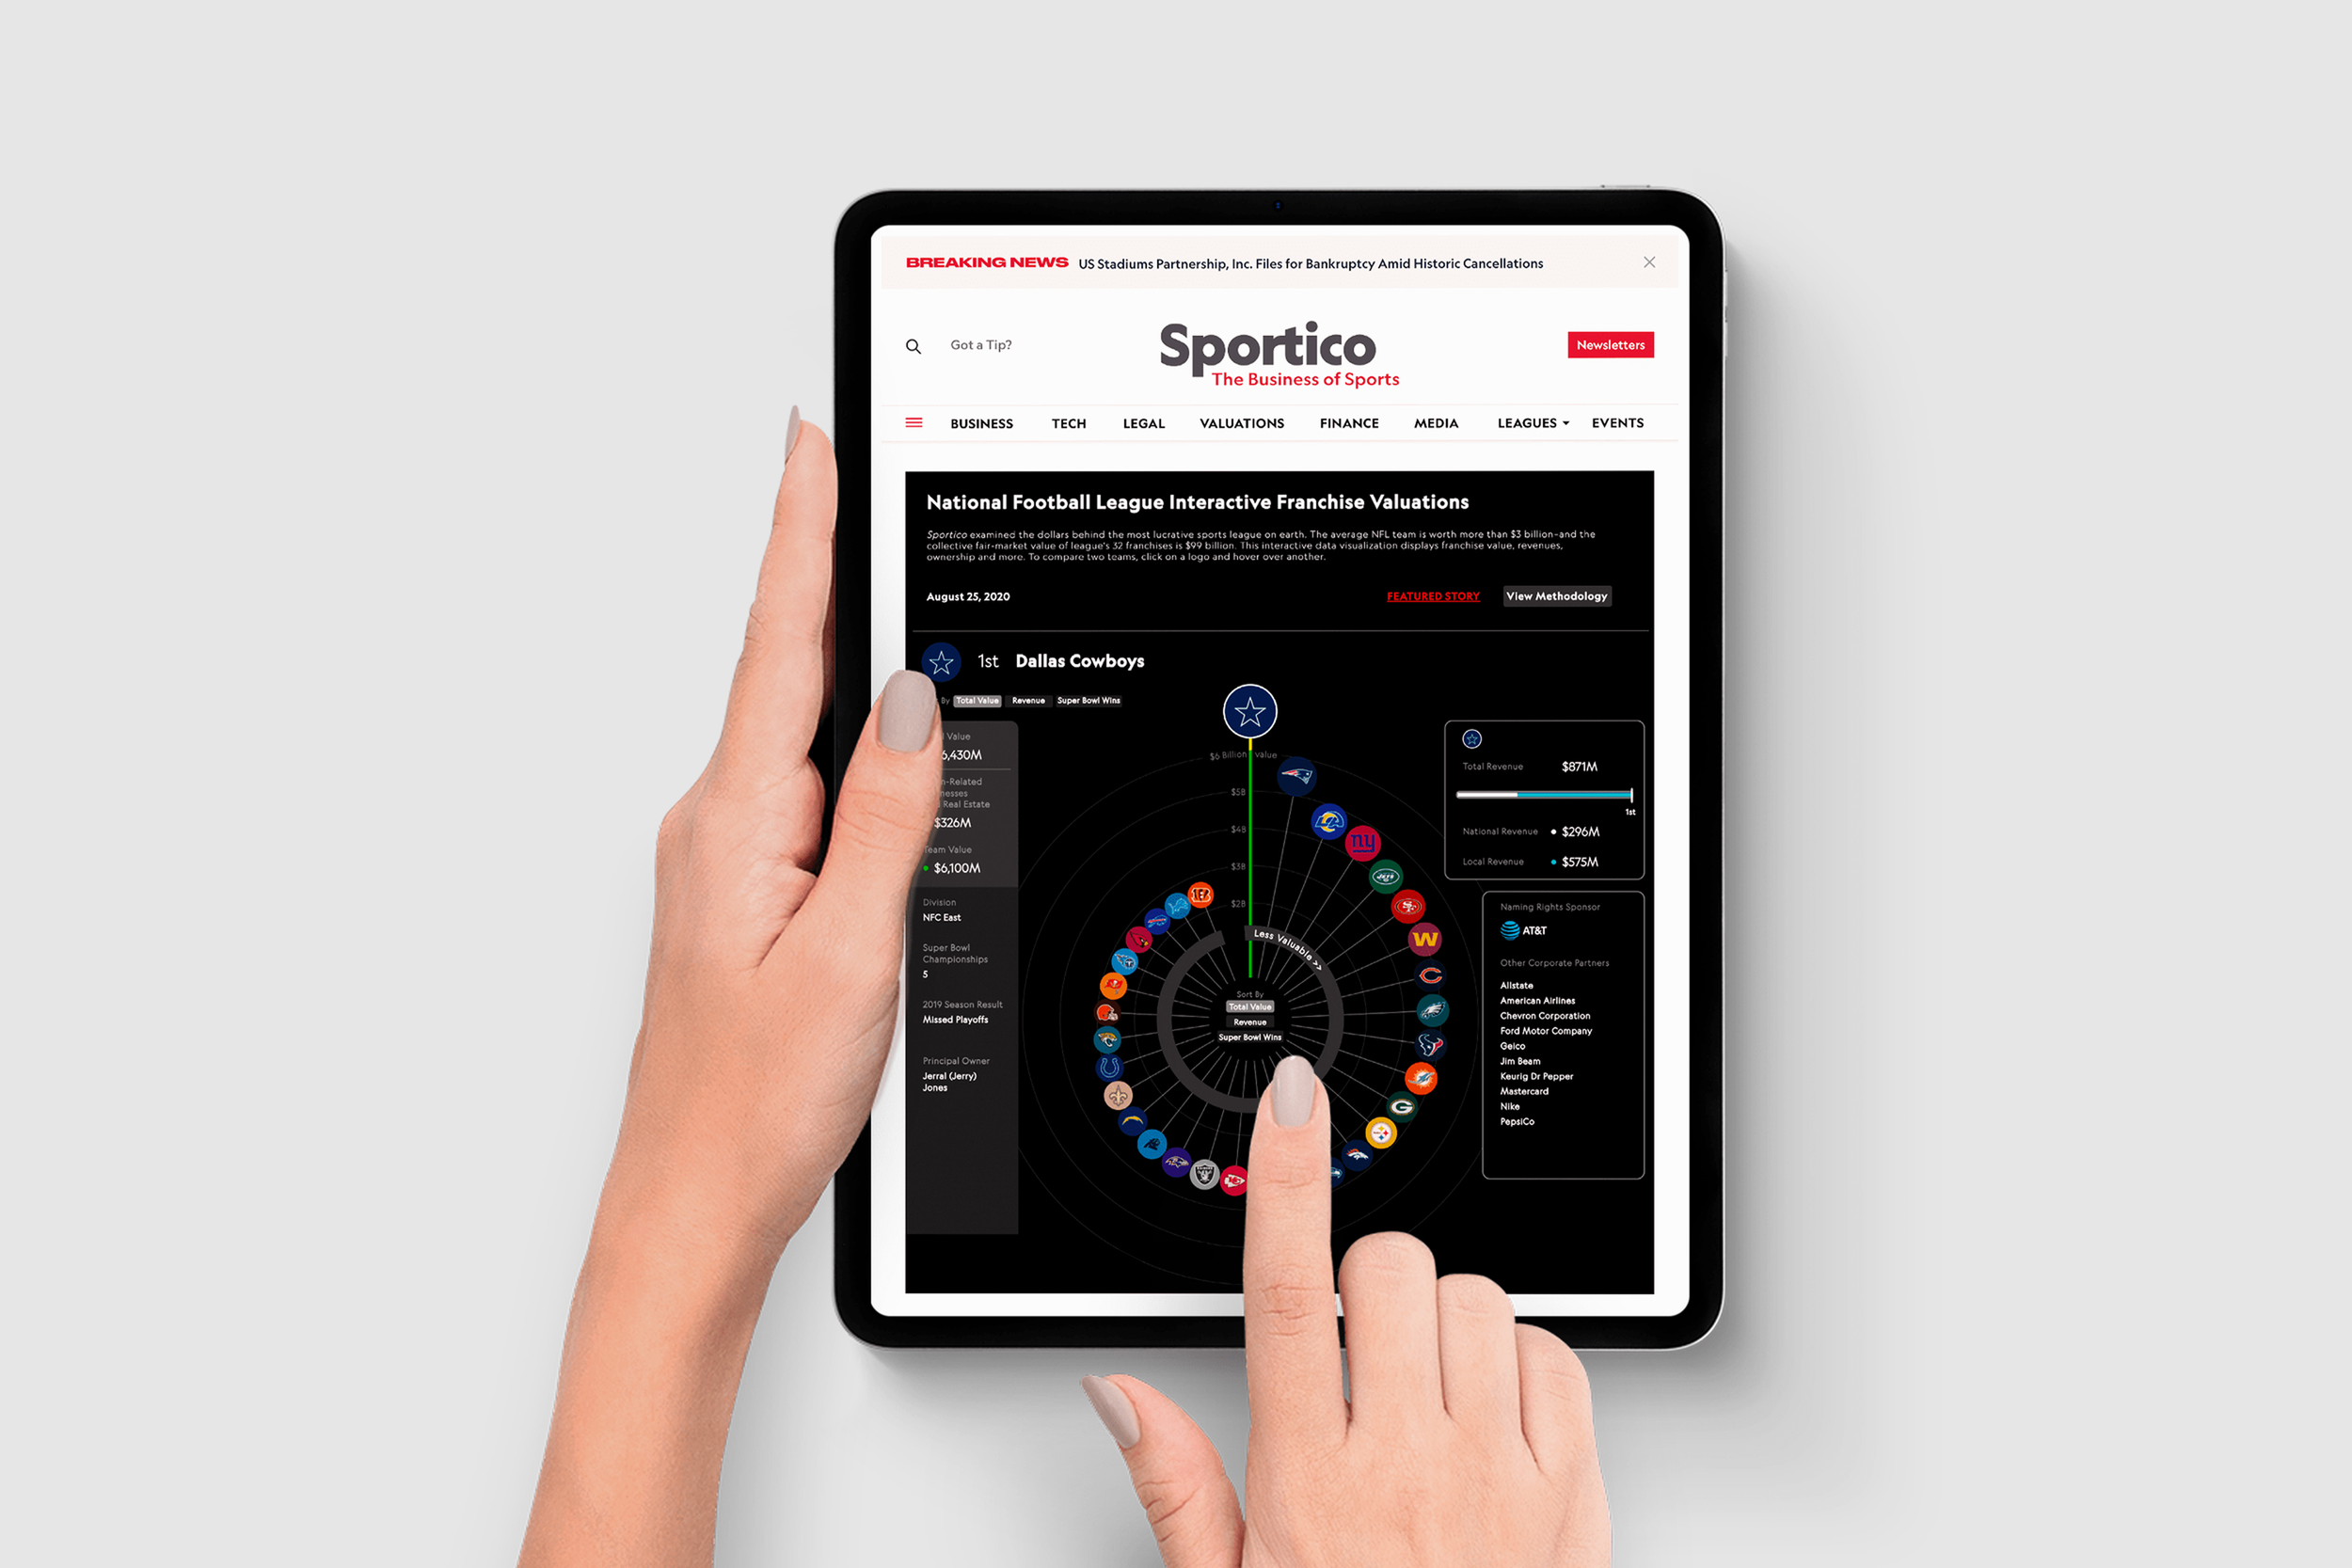
In collaboration with Sportico and the PMC Product Growth team, I designed the Franchise Valuation Tool end-to-end, a dynamic, interactive experience that transforms complex sports business data into an engaging, easy-to-use format.
In parallel, I contributed UX design to the Sportico editorial platform, helping scale its design system and interaction patterns so the valuation tool could integrate seamlessly and the site could support future editorial products.
The goal for the valuation tool was to blend storytelling, interactivity, and performance in a way that resonated with investors, analysts, journalists, and fans and to create a scalable framework for future valuations across multiple sports leagues.
Author
UX Opportunities Ven Diagram
This diagram maps the intersection of user needs, business goals, and competitive gaps to identify where Sportico could differentiate its franchise valuation experience. The overlap revealed opportunities to replace a buried, static UX with a dynamic, interactive tool that met editorial and data goals while exceeding user expectations.
Internal priorities:
Create a shareable, best-in-class product that reflects Sportico’s brand.
Integrate data seamlessly with editorial storytelling.
Build a scalable foundation for other sports leagues.
Featured article
These mobile wireframes show page types from the Sportico editorial platform, including Author, Featured Article, Article, Events, and Tags. My contributions focused on ensuring these templates supported the valuation tool’s integration and adhered to Sportico’s existing design system. I collaborated on interaction patterns, responsive layouts, and accessibility considerations to maintain a consistent, scalable experience across the platform.
High-fidelity prototypes included:
Article
The Executive Analyst – The Business-Minded Reader
Tech Savviness: High – uses data tools, subscribes to industry newsletters, and accesses platforms
Goals: Digest market reports, valuations, and M&A news to guide decisions
Pain Points: Content overload; hard to find quick takeaways or real-time data
Needs: Crisp summaries, sortable rankings, and downloadable charts for fast insights
Motivation: Stay ahead of competitors with sharp, actionable intelligence
2. Problem Framing
Sportico’s franchise valuations were previously buried in long articles, flat charts, or static PDFs, forcing users to scroll endlessly or jump between spreadsheets. This limited accessibility and diminished the impact of Sportico’s proprietary data.
Competitive Positioning – Franchise Valuation Platforms
No major players occupy the lower-left Under leveraged Experience quadrant, illustrating that while most editorial brands lean into either storytelling or flat data visualizations, their overall experiences remain incomplete. This whitespace highlights Sportico’s opportunity to break from traditional formats
Through interviews and data, we identified clear needs and priorities:
User needs:
Mobile-friendly, intuitive interface for quick team insights.
Visual clarity, interactivity, and context to aid comprehension.
Premium UX on par with Bloomberg or The Athletic.
3. Discovery & Research
We launched a discovery sprint to clarify audience goals, editorial constraints, and business priorities. This began with stakeholder interviews across editorial, product, marketing, and analytics teams, paired with a design audit of Bloomberg, FiveThirtyEight, ESPN, and The Athletic.
We also reviewed Sportico’s site analytics—bounce rates, scroll depth, and time-on-page and drew cross-brand insights from Variety, WWD, and Rolling Stone to benchmark performance and editorial integration.
Initial Design Explorations
Created three distinct user personas based on in-depth qualitative research, audience surveys, and behavioral analytics:
Providing a critical foundation for Sportico’s UX strategy. The insights guided site architecture, content hierarchy, and feature prioritization for both desktop and mobile, optimizing accessibility, streamlining navigation, and improving discoverability so the platform delivers actionable insights for every audience segment.
4. Concept Development
Traditional franchise valuation charts, tables, bar graphs, and static PDFs failed to convey the depth, context, or brand polish of Sportico’s proprietary data. To address this, we explored multiple visualization models and proposed a radial visualization: a tactile, editorial format designed to feel as premium as the content it represented.
5. UX Design & Prototyping
I designed the valuation tool end-to-end in Figma, starting with low-fidelity wireframes and moving into, high-fidelity prototypes. Early explorations evolved into an interactive radial hub for team rankings, with hover/tap states revealing quick stats and click-through panels unlocking deeper insights. Clarity, speed, and seamless editorial context were top priorities, supported by modular data cards for scalability across future leagues.
Mid-fidelity
Scrollable editorial panels with historical context
Contextual filters for revenue, championships, and growth
High-fidelity Franchise Valuation Tool
6. Usability Testing & Iteration
Testing formats included:
Moderated remote sessions to observe real-time navigation and capture qualitative insights
Unmoderated task flows to gather larger-scale behavioral patterns
Heatmap monitoring to track live engagement and drop-off points
Key improvements driven by feedback:
Refined filter placement and clearer language for faster data discovery
Onboarding overlays to guide first-time users through valuation features
Scrollable mobile stacks for smoother interaction with dense datasets
Incorporated empty states to keep users engaged when no data matched their filters
To validate the valuation tool’s usability and its integration into Sportico’s editorial platform,
we ran three rounds of testing with journalists, students, and internal stakeholders.
7. Visual & Interaction Design
To expand Sportico’s brand system
Introduced accent colors to visually differentiate team tiers
Designed motion states that guide interactions without distracting from the data
Created modular card components for scalable, reusable layouts
Ensured keyboard navigation and screen reader support to meet accessibility standards
The design was fully responsive, optimized for performance, and is now used across NBA + NHL tools. This means the design adapts to all devices, loads quickly, and has been repurposed beyond this project for other high-profile sports tools.
8. Implementation & Handoff
Delivered responsive design specifications across multiple breakpoints, ensuring the layout stayed sharp and functional from mobile to desktop.
Annotated Figma files with API triggers and fallback behaviors so developers knew exactly how the interface should react in every scenario.
Documented edge case logic to cover rare situations — like no search results, expired data, or zero matches — and outlined clear UI responses to avoid dead ends or confusing errors.
Led editorial team training so content managers could confidently update, maintain, and publish pages without developer support.
Tags
Partnered closely with PMC’s front-end development team throughout the build phase, aligning on technical requirements, validating design feasibility, and ensuring that every component matched the intended user experience across devices:
9. Impact & Outcome
The Sports Valuation Tool became more than a data resource — it set a new standard for how Sportico presents complex financial insights. By translating valuation data into an interactive, visually intuitive experience, the tool increased accessibility for both casual readers and industry professionals.
Authority Boost
Cemented Sportico as a leader in sports data.
Expanded Reach
Drew new audiences with interactive storytelling
Higher Engagement Increased time-on-page and return visits
Media Recognition
Featured in press, reports, and industry briefings
Future Blueprint
Set the model for
upcoming valuation tools
10. Personal Reflection
I approached this project from the user’s perspective, designing a data experience that sparked curiosity and felt dynamic,=never flat or corporate. When editorial, product, design, and development worked in sync, the result was engaging, meaningful, and empowering. This set a new benchmark for how Sportico delivers high-value sports business insights.
Strong UX transforms data from something you read into something you feel.
Hompage
The Sports Industry Newcomer – The Curious Learner
Tech Savviness: Moderate – familiar with online publications but new to deep business reporting
Goals: Learn sports business basics, trends, and key players
Pain Points: Overwhelmed by jargon and assumes content is “insider-only”
Needs: Intro guides, explainer articles, and clear definitions for easier learning
Motivation: Build knowledge and credibility without feeling left behind
The Media & PR Pro – The Story Seeker
Tech Savviness: Very high – uses media tools and social platforms to track narratives in real time
Goals: Find fresh angles, stats, and expert commentary for pitches and news
Pain Points: Slow updates, gated content, and lack of media-friendly assets
Needs: Timely alerts, quotable expert takes, and shareable visuals
Motivation: Be first to spot trends and shape the sports business conversation
These personas shaped filters, tone, and interaction depth.
To validate usability, we tested prototypes for radial layout clarity, friction within dense data zones, and natural interaction patterns across mobile and desktop. Feedback guided refinements that balanced rich data with readability, ensuring the experience remained intuitive and engaging on any device.
Editorial
Author
Section
-
Led end-to-end UX/UI design for Sportico’s interactive Franchise Valuation Tool — from discovery, research, and competitive analysis to wireframes, high-fidelity prototypes, and developer-ready specs. Collaborated on the editorial platform’s template designs to ensure seamless tool integration, consistent interaction patterns, and accessibility. Designed scalable, responsive components that elevated data visualization and improved usability across devices.
Events
Tags
Radial map with dynamic toggles
Team cards displaying value, ownership, and attendance
Alongside the valuation tool, we designed and refined new and existing editorial templates for the Sportico platform, including Homepage, Author, Featured Article, Article, Events, and Tag pages. My focus was on integrating the valuation tool while maintaining alignment with Sportico’s design system. I collaborated on interaction patterns, responsive layouts, and accessibility best practices to deliver a consistent, scalable experience across mobile and desktop. ehllo
High-Fidelity

Hey, I’m Mario
A UX designer actively looking for new opportunities. I’m excited to bring thoughtful, research-driven design driven by purpose, creativity, and meaningful impact.
Reach me at mfp181@gmail.com.